Market Outlook
December 15, 2016
Market Cues
Domestic Indices
Chg (%)
(Pts)
(Close)
Indian markets are likely to open on a Negative note tracing Global cues.
BSE Sensex
(0.4)
(95)
26,603
Nifty
(0.5)
(39)
8,182
US Markets fell in choppy trade Wednesday, led lower by energy and utilities, after
Mid Cap
(0.8)
(101)
12,241
the Federal Reserve raise rates for the second time in a decade.
Small Cap
(0.9)
(104)
12,118
The European markets ended Wednesday's session with modest losses, as investor’s
Bankex
(0.6)
(118)
21,039
exercised caution ahead of today's announcement from the Federal Reserve. The
market weakened slightly in early trade Wednesday, but settled into a sideways
trend for the rest of the session.
Global Indices
Chg (%)
(Pts)
(Close)
Indian shares closed lower on Wednesday in a volatile session amid caution ahead
Dow Jones
(0.6)
(119)
19,793
of the U.S. Federal Reserve's monetary policy decision later today. The Fed is widely
Nasdaq
(0.5)
(27)
5,437
expected to increase interest rates by 25 basis points, reflecting its first rate hike in a
FTSE
(0.3)
(19)
6,949
year.
Nikkei
0.0
3
19,254
News Analysis
Hang Seng
0.0
10
22,457
Shanghai Com
(0.5)
(15)
3,141
NTPC to replace 11 GW old capacity with `50,000cr investment
Fed hikes rate by 25 bps, projects faster increases next year
Detailed analysis on Pg2
Advances / Declines
BSE
NSE
Advances
891
470
Investor’s Ready Reckoner
Declines
1,767
1,131
Key Domestic & Global Indicators
Unchanged
145
71
Stock Watch: Latest investment recommendations on 150+ stocks
Refer Pg5 onwards
Volumes (` Cr)
Top Picks
BSE
2,383
CMP
Target
Upside
Company
Sector
Rating
NSE
16,150
(`)
(`)
(%)
Amara Raja Batt. Auto & Auto Ancill.
Buy
899
1,167
29.8
Alkem Laboratories Pharmaceuticals
Buy
1,615
1,989
23.2
Net Inflows (` Cr)
Net
Mtd
Ytd
HCL Tech
IT
Buy
820
1,000
22.0
FII
(732)
101
27,379
Power Grid Corp. Power
Buy
182
223
22.6
MFs
(222)
411
38,596
Navkar Corp.
Others
Buy
175
265
51.5
More Top Picks on Pg3
Top Gainers
Price (`)
Chg (%)
Key Upcoming Events
Hcc
41
4.6
Previous
Consensus
Date
Region
Event Description
Reading
Expectations
Welcorp
78
3.9
Dec 15 India
Monthly Wholesale Prices YoY%
3.15
3.10
Prestige
163
3.4
Dec 15 US
Initial Jobless claims
258.00
255.00
Axisbank
467
3.2
Dec 15 Germany PMI Manufacturing
54.30
54.50
Gruh
325
3.0
Dec 15 US
Consumer price index (mom)
0.40
0.20
Dec 15 UK
BOE Announces rates
0.25
0.25
Dec 15 US
FOMC rate decision
0.50
0.75
Top Losers
Price (`)
Chg (%)
More Events on Pg4
Kscl
393
(8.5)
Den
71
(5.2)
Coalindia
292
(4.4)
Upl
652
(4.0)
Amtekauto
36
(4.0)
As on December 14, 2016
Market Outlook
December 15, 2016
News Analysis
NTPC to replace 11 GW old capacity with `50,000cr investment
In a bid to cut emissions, state-run power giant NTPC has decided to replace over
25-year-old power plants totalling 11 GW capacity in the next five years at an
investment of `50,000cr. Power Minister Piyush Goyal was of the view that these
plants should not start from scratch for getting all clearance as old machines will
be replaced with new more energy efficient ones with far lower emissions meeting
global standards. The minister said with all approvals in place in next 3-4 months,
the huge investment of `50,000cr would be done in next five years.
Fed hikes rate by 25 bps, projects faster increases next year
U.S. Federal Reserve has raised the funds rates by 25 bps after a gap of a year.
While this has been along the market expectations, Fed's signal to raise rates by
three times next year is faster than market expectations. This is likely to increase US
interest rates faster. This is likely to see further pressure on rupee due to possible
selling in the bond markets by the foreign investors. The Trump presidency is
expected to boost the US infrastructure sector which will increase the inflation in
the US. This has been seen positively by the US markets which are at their all time
highs.
While the strong US economy is good for global economy, the faster rise in US
interest rates will be seen negatively by the markets especially at a time when there
are concerns on domestic growth. We believe that the domestic markets may
remain volatile for some time, as uncertainty continues to remain high over the
demonetization impact with addition of next year's higher quantum of Fed hikes.
Economic and Political News
CAD likely to worsen, expected at $10 bn for FY17: Citigroup
Govt trying to implement GST from 1 April FY17, says Rajnath Singh
7th Pay Commission inflates Uttar Pradesh salary bill by 12%
Corporate News
NTPC to invest `2,648cr in developing three coal blocks in Odisha
Welspun India forays into flooring solutions with `600cr carpet plant
MTNL Q2 net loss at `768cr
Market Outlook
December 15, 2016
Top Picks ★★★★★
Large Cap
Market Cap
CMP
Target
Upside
Company
Rationale
(` Cr)
(`)
(`)
(%)
To outpace battery industry growth due to better
Amara Raja Batteries
15,353
899
1,167
29.8
technological products leading to market share gains in
both the automotive OEM and replacement segments.
Strong growth in domestic business due to its leadership in
Alkem Laboratories
19,310
1,615
1,989
23.2
acute therapeutic segment. Alkem expects to launch more
products in USA, which bodes for its international business.
The stock is trading at attractive valuations and is factoring
HCL Tech
1,15,668
820
1,000
22.0
all the bad news.
Back on the growth trend; expect a long term growth of 14%
Infosys
2,29,476
999
1,249
25.0
to be a US$20bn in FY2020.
Strong order backlog and improvement in execution would
Larsen & Tourbo
1,26,781
1,360
1,634
20.1
trigger the growth for the L&T
One of the largest pharma companies with strong
international presence. It has a rich pipeline of ANDAs
Lupin
67,001
1,486
1,809
21.7
which is also one of the largest among the generic
companies.
Going forward, we expect the company to report strong
Power Grid Corporation
95,163
182
223
22.6
top-line CAGR of ~16% and bottom-line CAGR of ~19%
over FY16-18 on back of strong capitalization guidance
Source: Company, Angel Research
Mid Cap
Market Cap
CMP
Target
Upside
Company
Rationale
(` Cr)
(`)
(`)
(%)
We expect the company would report strong profitability
Asian Granito
638
212
351
65.6
owing to better product mix, higher B2C sales and
amalgamation synergy.
Among the top 4 players in the consumer durables segment.
Bajaj Electricals
2,237
221
274
23.6
Improved profitability backed by turn around in E&P
segment. Strong order book lends earnings visibility.
Favourable outlook for AC industry augurs well for Cooling
Blue Star
4,417
463
634
36.9
products business which is outgrowing the market. EMPPAC
division's is likely to turn around on improving economy
With a focus on the low and medium income (LMI)
Dewan Housing Finance
7,585
242
350
44.4
consumer segment, the company has increased its presence
in tier-II & III cities where the growth opportunity is immense.
Strong loan growth backed by diversified loan portfolio and
adequate CAR. ROE & ROA likely to remain decent as risk of
Equitas Holdings
5,089
152
235
54.9
dilution remains low. Attractive valuations considering
growth.
Economic recovery to have favourable impact on advertising
& circulation revenue growth. Further, the acquisition of a
Jagran Prakashan
5,484
168
225
34.1
radio business (Radio City) would also boost the company's
revenue growth.
Speedier execution and speedier sales, strong revenue
Mahindra Lifespace
1,477
360
522
45.0
visibilty in short-to-long run, attractive valuations
We expect the company to report strong growth on back of
healthy growth in domestic branded sales (owing to
Mirza International
984
82
107
30.8
aggressive ad spend and addition in the number of EBOs &
multi-brand outlets [MBOs]) and healthy export revenues.
Massive capacity expansion along with rail advantage at
Navkar Corporation
2,494
175
265
51.5
ICD as well CFS augurs well for the company.
Strong brands and distribution network would boost growth
Siyaram Silk Mills
1,127
1,202
1,605
33.5
going ahead. Stock currently trades at an inexpensive
valuation.
Market leadership in Hindi news genre and no. 2 viewership
ranking in English news genre, exit from the radio business,
TV Today Network
1,703
286
385
34.9
and anticipated growth in ad spends by corporate to benefit
the stock.
Source: Company, Angel Research
Market Outlook
December 15, 2016
Key Upcoming Events
Global economic events release calendar
Bloomberg Data
Date
Time
Country
Event Description
Unit
Period
Last Reported
Estimated
Dec 15, 2016
12:00 PM
India Monthly Wholesale Prices YoY%
% Change
Nov
3.15
3.10
7:00 PM
US
Initial Jobless claims
Thousands
Dec 10
258.00
255.00
2:00 PM
Germany
PMI Manufacturing
Value Dec P
54.30
54.50
7:00 PM
US Consumer price index (mom)
% Change
Nov
0.40
0.20
5:30 PM
UK
BOE Announces rates
% Ratio
Dec 15
0.25
0.25
12:30 AM
US
FOMC rate decision
%
Dec 14
0.50
0.75
Dec 16, 2016
7:00 PM
US
Housing Starts
Thousands
Nov
1,323.00
1,230.00
7:00 PM
US
Building permits
Thousands
Nov
1,260.00
1,240.00
3:30 PM Euro Zone
Euro-Zone CPI (YoY)
%
Nov F
0.60
0.60
Dec 21, 2016
8:30 PM Euro Zone Euro-Zone Consumer Confidence
Value
Dec A
(6.10)
8:30 PM
US
Existing home sales
Million
Nov
5.60
5.50
Dec 22, 2016
3:00 PM
UK
GDP (YoY)
% Change
3Q F
2.30
Dec 23, 2016
7:00 PM
US
GDP Qoq (Annualised)
% Change
3Q T
3.20
3.30
8:30 PM
US
New home sales
Thousands
Nov
563.00
575.00
Dec 27, 2016
8:30 PM
US
Consumer ConfidenceS.A./ 1985=100
Dec
107.10
Jan 01, 2017
6:30 AM
China
PMI Manufacturing
Value
Dec
51.70
Jan 03, 2017
3:00 PM
UK
PMI Manufacturing
Value
Dec
53.40
2:25 PM
Germany Unemployment change (000's)
Thousands
Dec
(5.00)
Jan 06, 2017
7:00 PM
US
Change in Nonfarm payrolls
Thousands
Dec
178.00
7:00 PM
US
Unnemployment rate
% Dec
4.60
Jan 08, 2017
China
Exports YoY%
% Change
Dec
0.10
Jan 09, 2017
3:00 PM
UK
Industrial Production (YoY)
% Change
Nov
(1.10)
Jan 11, 2017
5:30 PM
India
Industrial Production YoY
% Change
Nov
(1.90)
Jan 12, 2017
3:00 PM
UK
CPI (YoY)
% Change
Dec
1.20
Jan 17, 2017
China
Consumer Price Index (YoY)
% Change
Dec
2.30
China
Industrial Production (YoY)
% Change
Dec
6.20
China
Real GDP (YoY)
% Change
4Q
6.70
Source: Bloomberg, Angel Research
Market Outlook
December 15, 2016
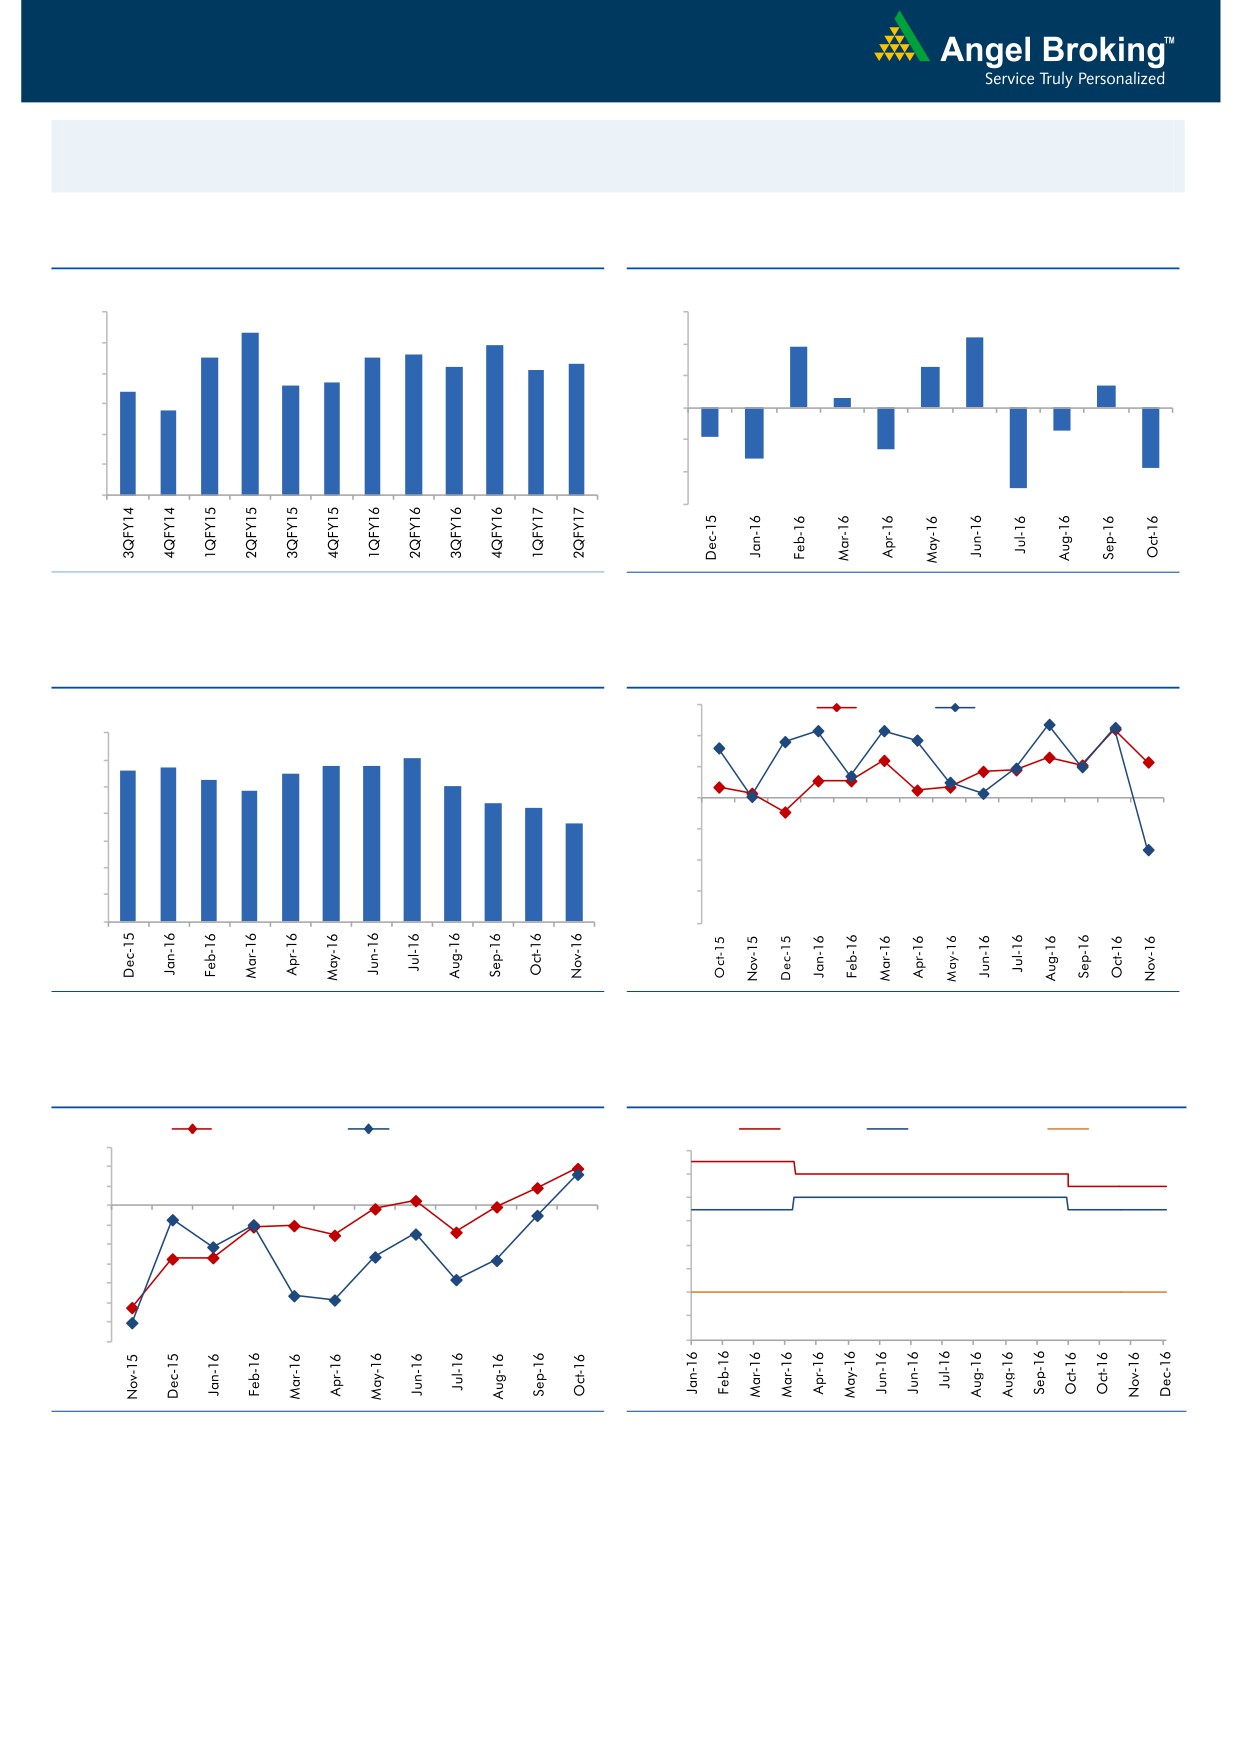
Macro watch
Exhibit 1: Quarterly GDP trends
Exhibit 2: IIP trends
(%)
(%)
9.0
3.0
8.3
2.2
7.9
1.9
7.5
7.5
7.6
8.0
7.3
2.0
7.2
7.1
1.3
6.6
6.7
0.7
7.0
6.4
1.0
0.3
5.8
6.0
-
5.0
(1.0)
(0.7)
(0.9)
4.0
(1.3)
(2.0)
(1.6)
(1.9)
3.0
(3.0)
(2.5)
Source: CSO, Angel Research
Source: MOSPI, Angel Research
Exhibit 3: Monthly CPI inflation trends
Exhibit 4: Manufacturing and services PMI
56.0
Mfg. PMI
Services PMI
(%)
7.0
54.0
6.1
5.6
5.7
5.8
5.8
6.0
5.3
5.5
5.1
52.0
4.8
5.0
4.4
4.2
50.0
3.6
4.0
48.0
3.0
46.0
2.0
1.0
44.0
-
42.0
Source: MOSPI, Angel Research
Source: Market, Angel Research; Note: Level above 50 indicates expansion
Exhibit 5: Exports and imports growth trends
Exhibit 6: Key policy rates
(%)
Exports yoy growth
Imports yoy growth
(%)
Repo rate
Reverse Repo rate
CRR
15.0
7.00
10.0
6.50
5.0
6.00
0.0
(5.0)
5.50
(10.0)
5.00
(15.0)
4.50
(20.0)
4.00
(25.0)
3.50
(30.0)
(35.0)
3.00
Source: Bloomberg, Angel Research
Source: RBI, Angel Research
Market Outlook
December 15, 2016
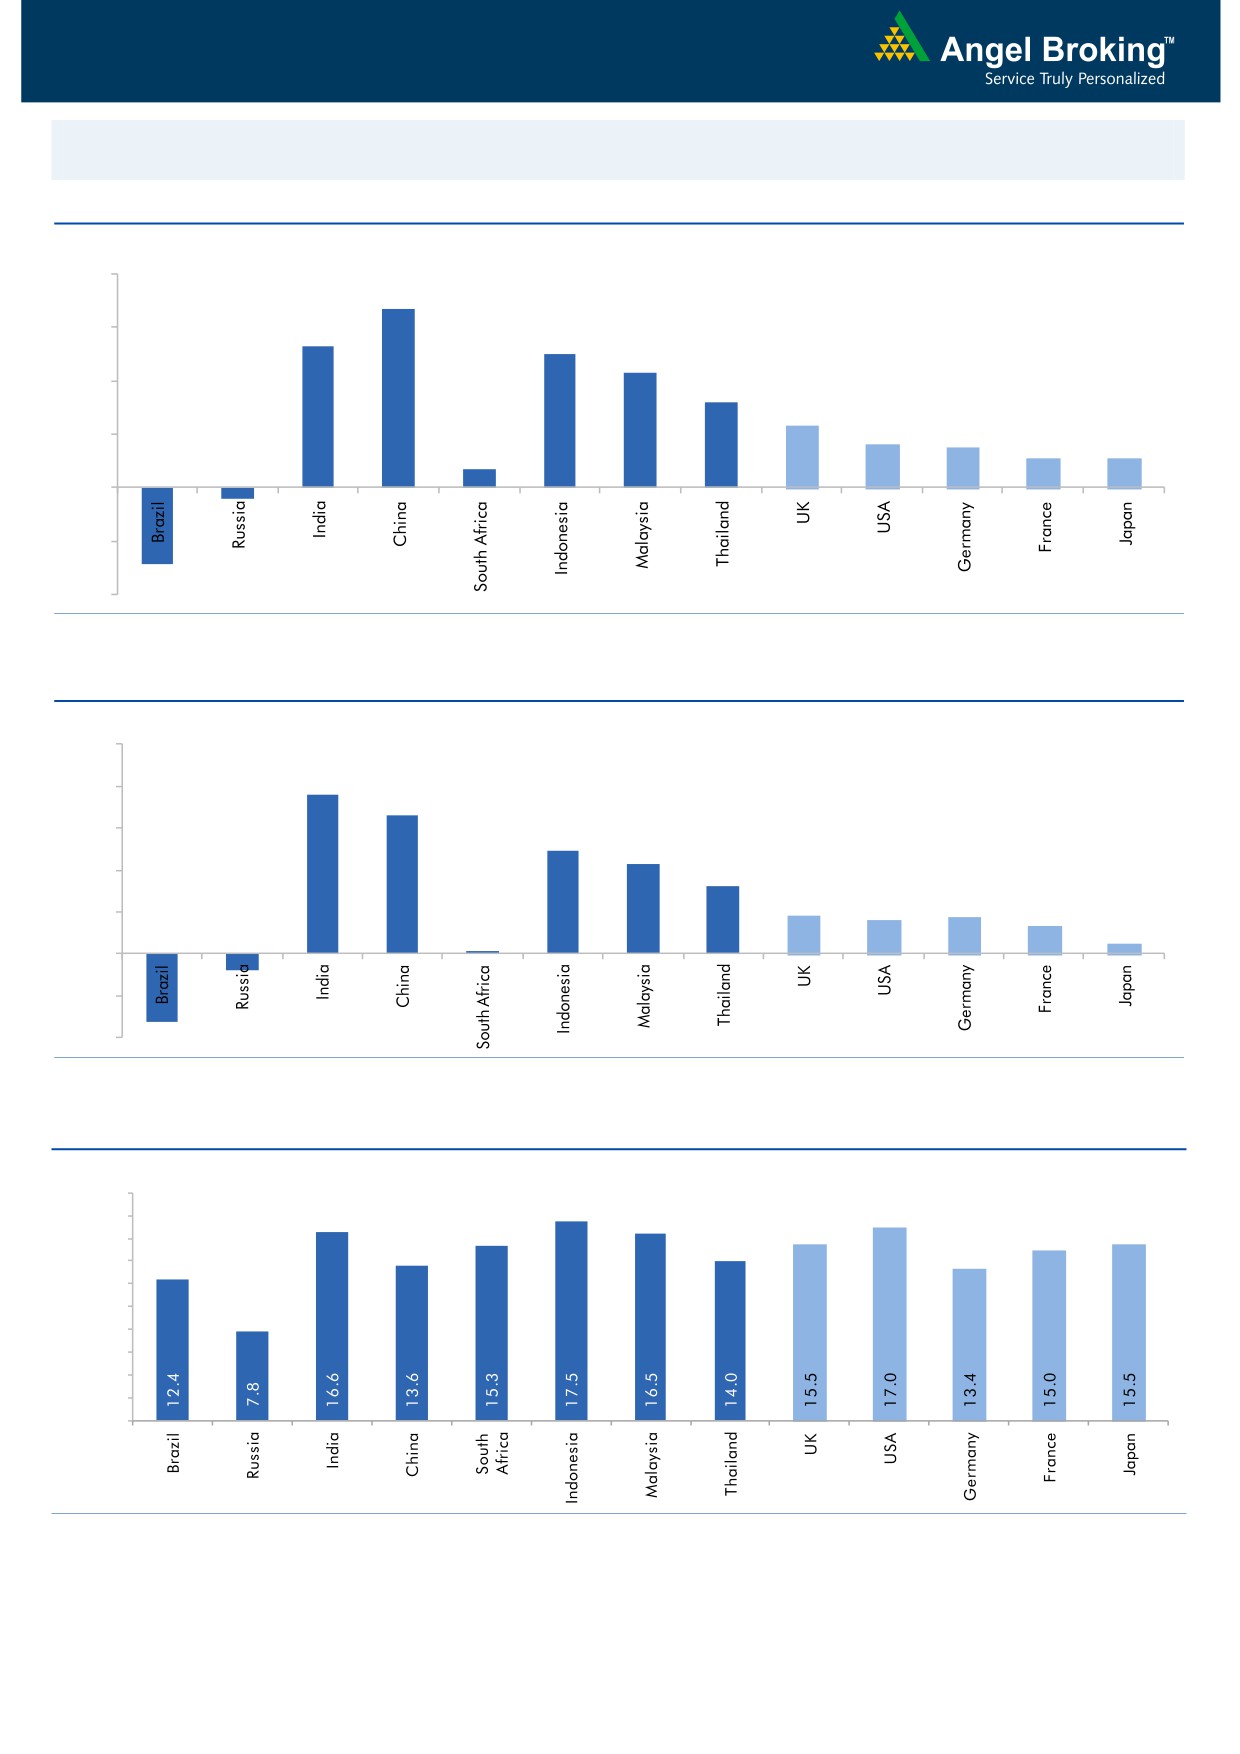
Global watch
Exhibit 1: Latest quarterly GDP Growth (%, yoy) across select developing and developed countries
(%)
8.0
6.7
5.3
6.0
5.0
0.7
4.3
4.0
3.2
2.3
1.6
1.5
2.0
1.1
1.1
-
(2.0)
(0.4)
(2.9)
(4.0)
Source: Bloomberg, Angel Research
Exhibit 2: 2016 GDP Growth projection by IMF (%, yoy) across select developing and developed countries
(%)
10.0
7.6
8.0
6.6
6.0
4.9
4.3
4.0
3.2
1.8
1.7
1.6
1.3
2.0
(0.8)
0.5
(3.3)
0.1
-
(2.0)
(4.0)
Source: IMF, Angel Research
Exhibit 3: One year forward P-E ratio across select developing and developed countries
(x)
20.0
18.0
16.0
14.0
12.0
10.0
8.0
6.0
4.0
2.0
-
Source: IMF, Angel Research
Market Outlook
December 15, 2016
Exhibit 4: Relative performance of indices across globe
Returns (%)
Country
Name of index
Closing price
1M
3M
1YR
Brazil
Bovespa
59,281
(3.1)
2.2
33.4
Russia
Micex
2,247
9.8
10.7
29.9
India
Nifty
8,222
(1.4)
(7.7)
6.2
China
Shanghai Composite
3,155
(2.2)
1.6
(10.9)
South Africa
Top 40
44,171
1.5
(3.5)
1.6
Mexico
Mexbol
46,870
(1.1)
(1.2)
11.9
Indonesia
LQ45
890
0.5
0.2
12.6
Malaysia
KLCI
1,645
(0.5)
(2.7)
(1.4)
Thailand
SET 50
957
0.3
5.6
9.2
USA
Dow Jones
19,911
5.9
10.2
13.6
UK
FTSE
6,969
3.5
4.4
15.0
Japan
Nikkei
19,251
11.0
13.2
(3.5)
Germany
DAX
11,285
5.3
8.5
4.8
France
CAC
4,804
5.8
9.1
2.1
Source: Bloomberg, Angel Research
Stock Watch
December 15, 2016
Company Name
Reco
CMP
Target
Mkt Cap
Sales ( Čcr )
OPM(%)
EPS (Č)
PER(x)
P/BV(x)
RoE(%)
EV/Sales(x)
(Č)
Price ( Č)
( Č cr )
FY17E FY18E
FY17E
FY18E
FY17E
FY18E
FY17E
FY18E
FY17E
FY18E
FY17E
FY18E
FY17E
FY18E
Agri / Agri Chemical
Rallis
Accumulate
198
209
3,849
1,937
2,164
13.3
14.3
9.0
11.0
22.0
18.0
3.8
3.3
18.4
19.8
2.0
1.8
United Phosphorus
Neutral
652
-
33,059
15,176
17,604
18.5
18.5
37.4
44.6
17.4
14.6
3.4
2.8
21.4
21.2
2.3
1.9
Auto & Auto Ancillary
Ashok Leyland
Buy
77
111
21,984
22,407
26,022
10.6
10.6
5.2
6.4
14.8
12.0
3.4
2.8
23.6
24.7
1.1
0.9
Bajaj Auto
Neutral
2,649
-
76,666
25,093
27,891
19.5
19.2
143.9
162.5
18.4
16.3
5.2
4.4
30.3
29.4
2.8
2.4
Bharat Forge
Neutral
974
-
22,675
7,726
8,713
20.5
21.2
35.3
42.7
27.6
22.8
5.1
4.6
18.9
20.1
3.0
2.6
Eicher Motors
Neutral
21,802
-
59,216
16,583
20,447
17.5
18.0
598.0
745.2
36.5
29.3
12.5
9.5
41.2
38.3
3.4
2.7
Gabriel India
Buy
106
130
1,524
1,544
1,715
9.0
9.3
5.4
6.3
19.7
16.8
3.7
3.3
18.9
19.5
0.9
0.8
Hero Motocorp
Accumulate
3,163
3,541
63,165
30,958
34,139
15.7
15.7
193.6
208.3
16.3
15.2
6.4
5.3
34.2
30.5
1.9
1.7
Jamna Auto Industries Neutral
168
-
1,345
1,486
1,620
9.8
9.9
15.0
17.2
11.2
9.8
2.5
2.1
21.8
21.3
1.0
0.9
L G Balakrishnan & Bros Neutral
601
-
943
1,302
1,432
11.6
11.9
43.7
53.0
13.8
11.3
1.9
1.8
13.8
14.2
0.8
0.7
Mahindra and Mahindra Neutral
1,175
-
72,957
46,534
53,077
11.6
11.7
67.3
78.1
17.5
15.1
2.8
2.5
15.4
15.8
1.5
1.3
Maruti
Buy
5,142
6,006
155,333
68,057
82,958
15.8
15.5
212.1
261.2
24.2
19.7
4.8
4.0
19.8
20.3
2.0
1.5
Minda Industries
Neutral
309
-
2,450
2,728
3,042
9.0
9.1
68.2
86.2
4.5
3.6
1.0
0.8
23.8
24.3
1.0
0.8
Motherson Sumi
Neutral
320
-
44,930
45,896
53,687
7.8
8.3
13.0
16.1
24.6
19.9
7.9
6.3
34.7
35.4
1.1
0.9
Rane Brake Lining
Neutral
991
-
784
511
562
11.3
11.5
28.1
30.9
35.3
32.1
5.4
4.9
15.3
15.0
1.7
1.5
Setco Automotive
Neutral
37
-
488
741
837
13.0
13.0
15.2
17.0
2.4
2.2
0.4
0.4
15.8
16.3
1.0
0.9
Tata Motors
Neutral
473
-
136,449
300,209
338,549
8.9
8.4
42.7
54.3
11.1
8.7
1.8
1.5
15.6
17.2
0.6
0.5
TVS Motor
Neutral
380
-
18,049
13,390
15,948
6.9
7.1
12.8
16.5
29.8
23.0
7.4
5.9
26.3
27.2
1.4
1.1
Amara Raja Batteries
Buy
899
1,167
15,353
5,504
6,605
17.6
17.5
33.4
40.9
26.9
22.0
5.9
4.8
22.1
22.0
2.8
2.3
Exide Industries
Neutral
171
-
14,561
7,439
8,307
15.0
15.0
8.1
9.3
21.2
18.4
3.0
2.6
14.3
16.7
1.6
1.4
Apollo Tyres
Buy
197
235
10,038
12,877
14,504
14.3
13.9
21.4
23.0
9.2
8.6
1.4
1.2
16.4
15.2
0.9
0.9
Ceat
Buy
1,240
1,450
5,015
7,524
8,624
13.0
12.7
131.1
144.3
9.5
8.6
1.7
1.5
19.8
18.6
0.7
0.7
JK Tyres
Neutral
117
-
2,651
7,455
8,056
15.0
15.0
21.8
24.5
5.4
4.8
1.1
0.9
22.8
21.3
0.5
0.4
Swaraj Engines
Neutral
1,359
-
1,688
660
810
15.2
16.4
54.5
72.8
24.9
18.7
7.8
7.1
31.5
39.2
2.4
1.9
Subros
Neutral
162
-
971
1,488
1,681
11.7
11.9
6.4
7.2
25.3
22.6
2.7
2.4
10.8
11.4
0.9
0.8
Indag Rubber
Neutral
179
-
471
286
326
19.8
16.8
11.7
13.3
15.3
13.5
2.6
2.4
17.8
17.1
1.3
1.1
Capital Goods
ACE
Neutral
48
-
473
709
814
4.1
4.6
1.4
2.1
34.2
22.8
1.4
1.3
4.4
6.0
0.8
0.7
BEML
Neutral
898
-
3,738
3,451
4,055
6.3
9.2
31.4
57.9
28.6
15.5
1.7
1.6
6.3
10.9
1.2
1.0
Bharat Electronics
Neutral
1,425
-
31,826
8,137
9,169
16.8
17.2
58.7
62.5
24.3
22.8
3.8
3.3
44.6
46.3
2.9
2.6
Stock Watch
December 15, 2016
Company Name
Reco
CMP
Target
Mkt Cap
Sales ( Čcr )
OPM(%)
EPS (Č)
PER(x)
P/BV(x)
RoE(%)
EV/Sales(x)
(Č)
Price ( Č)
( Č cr )
FY17E
FY18E
FY17E
FY18E
FY17E
FY18E
FY17E
FY18E
FY17E
FY18E
FY17E
FY18E
FY17E
FY18E
Capital Goods
Voltas
Buy
322
407
10,651
6,511
7,514
7.9
8.7
12.9
16.3
25.0
19.8
4.5
3.9
16.7
18.5
1.4
1.2
BGR Energy
Neutral
116
-
837
16,567
33,848
6.0
5.6
7.8
5.9
14.9
19.7
0.9
0.8
4.7
4.2
0.2
0.1
BHEL
Neutral
125
-
30,644
28,797
34,742
-
2.8
2.3
6.9
54.4
18.1
0.9
0.9
1.3
4.8
0.7
0.5
Blue Star
Buy
463
634
4,417
4,283
5,077
5.9
7.3
14.9
22.1
31.1
20.9
6.0
5.1
20.4
26.4
1.1
0.9
Crompton Greaves
Neutral
59
-
3,707
5,777
6,120
5.9
7.0
3.3
4.5
17.9
13.1
0.8
0.8
4.4
5.9
0.6
0.5
Greaves Cotton
Neutral
125
-
3,056
1,755
1,881
16.8
16.9
7.8
8.5
16.0
14.7
3.2
3.0
20.6
20.9
1.4
1.3
Inox Wind
Neutral
204
-
4,517
5,605
6,267
15.7
16.4
24.8
30.0
8.2
6.8
2.3
1.7
25.9
24.4
0.8
0.7
KEC International
Neutral
139
-
3,572
9,294
10,186
7.9
8.1
9.9
11.9
14.0
11.7
2.1
1.8
15.6
16.3
0.6
0.6
Thermax
Neutral
824
-
9,823
5,421
5,940
7.3
7.3
25.7
30.2
32.1
27.3
3.9
3.6
12.2
13.1
1.7
1.6
VATech Wabag
Buy
481
681
2,624
3,136
3,845
8.9
9.1
26.0
35.9
18.5
13.4
2.3
2.0
13.4
15.9
0.7
0.6
Cement
ACC
Neutral
1,313
-
24,658
11,225
13,172
13.2
16.9
44.5
75.5
29.5
17.4
2.8
2.6
11.2
14.2
2.2
1.9
Ambuja Cements
Neutral
205
-
40,736
9,350
10,979
18.2
22.5
5.8
9.5
35.4
21.6
3.0
2.7
10.2
12.5
4.4
3.7
India Cements
Neutral
112
-
3,443
4,364
4,997
18.5
19.2
7.9
11.3
14.2
9.9
1.0
1.0
8.0
8.5
1.6
1.4
JK Cement
Neutral
713
-
4,985
4,398
5,173
15.5
17.5
31.2
55.5
22.9
12.9
2.7
2.4
12.0
15.5
1.7
1.4
J K Lakshmi Cement
Buy
358
565
4,213
2,913
3,412
14.5
19.5
7.5
22.5
47.7
15.9
2.9
2.5
12.5
18.0
2.0
1.7
Orient Cement
Buy
127
215
2,605
2,114
2,558
18.5
20.5
8.1
11.3
15.7
11.3
2.3
2.0
9.0
14.0
1.9
1.4
UltraTech Cement
Neutral
3,316
-
91,013
25,768
30,385
21.0
23.5
111.0
160.0
29.9
20.7
3.8
3.3
13.5
15.8
3.6
3.0
Construction
ITNL
Neutral
101
-
3,326
8,946
10,017
31.0
31.6
8.1
9.1
12.5
11.1
0.5
0.5
4.2
5.0
3.7
3.4
KNR Constructions
Buy
173
802
2,432
1,385
1,673
14.7
14.0
41.2
48.5
4.2
3.6
0.8
0.7
14.9
15.2
1.8
1.5
Larsen & Toubro
Buy
1,360
1,634
126,781
111,017
124,908
11.0
11.0
61.1
66.7
22.3
20.4
2.7
2.5
13.1
12.9
2.2
2.0
Gujarat Pipavav Port
Neutral
140
-
6,783
705
788
52.2
51.7
5.0
5.6
28.1
25.1
2.8
2.5
11.2
11.2
9.3
7.8
Nagarjuna Const.
Neutral
83
-
4,609
8,842
9,775
9.1
8.8
5.3
6.4
15.6
13.0
1.2
1.1
8.2
9.1
0.7
0.6
PNC Infratech
Buy
104
143
2,665
2,350
2,904
13.1
13.2
9.0
8.8
11.5
11.8
0.4
0.4
15.9
13.9
1.3
1.0
Simplex Infra
Neutral
285
-
1,410
6,829
7,954
10.5
10.5
31.4
37.4
9.1
7.6
0.9
0.9
9.9
13.4
0.6
0.5
Power Mech Projects
Neutral
459
-
675
1,801
2,219
12.7
14.6
72.1
113.9
6.4
4.0
1.2
1.0
16.8
11.9
0.4
0.3
Sadbhav Engineering
Accumulate
270
298
4,633
3,598
4,140
10.3
10.6
9.0
11.9
30.0
22.7
3.1
2.8
9.9
11.9
1.6
1.3
NBCC
Neutral
226
-
13,536
7,428
9,549
7.9
8.6
8.2
11.0
27.5
20.5
1.4
1.1
28.2
28.7
1.5
1.1
MEP Infra
Neutral
39
-
628
1,877
1,943
30.6
29.8
3.0
4.2
12.9
9.2
6.2
4.2
0.6
0.6
1.7
1.6
SIPL
Neutral
90
-
3,175
1,036
1,252
65.5
66.2
(8.4)
(5.6)
3.4
3.9
(22.8)
(15.9)
11.3
9.4
Stock Watch
December 15, 2016
Company Name
Reco
CMP
Target
Mkt Cap
Sales ( Čcr )
OPM(%)
EPS (Č)
PER(x)
P/BV(x)
RoE(%)
EV/Sales(x)
(Č)
Price ( Č)
( Č cr )
FY17E
FY18E
FY17E
FY18E
FY17E
FY18E
FY17E
FY18E
FY17E
FY18E
FY17E
FY18E
FY17E
FY18E
Construction
Engineers India
Neutral
306
-
10,300
1,725
1,935
16.0
19.1
11.4
13.9
26.8
22.0
3.7
3.6
13.4
15.3
4.9
4.4
Financials
Axis Bank
Buy
467
630
111,450
46,932
53,575
3.5
3.4
32.4
44.6
14.4
10.5
1.9
1.6
13.6
16.5
-
-
Bank of Baroda
Neutral
158
-
36,475
19,980
23,178
1.8
1.8
11.5
17.3
13.8
9.2
1.6
1.3
8.3
10.1
-
-
Canara Bank
Neutral
301
-
16,368
15,225
16,836
1.8
1.8
14.5
28.0
20.8
10.8
1.4
1.2
5.8
8.5
-
-
Dewan Housing Finance Buy
242
350
7,585
2,225
2,688
2.9
2.9
29.7
34.6
8.2
7.0
1.3
1.1
16.1
16.8
-
-
Equitas Holdings
Buy
152
235
5,089
939
1,281
11.7
11.5
5.8
8.2
26.2
18.5
2.3
2.0
10.9
11.5
-
-
Federal Bank
Neutral
70
-
11,976
9,353
10,623
2.9
2.9
4.4
5.8
15.8
12.0
1.5
1.3
9.5
11.0
-
-
HDFC
Neutral
1,266
-
200,111
11,475
13,450
3.4
3.4
45.3
52.5
27.9
24.1
5.4
4.8
20.2
20.5
-
-
HDFC Bank
Accumulate
1,180
1,350
301,152
46,097
55,433
4.5
4.5
58.4
68.0
20.2
17.4
3.5
3.0
18.8
18.6
-
-
ICICI Bank
Buy
261
315
151,676
42,800
44,686
3.1
3.3
18.0
21.9
14.5
11.9
2.0
1.8
11.1
12.3
-
-
Lakshmi Vilas Bank
Buy
143
174
2,568
3,339
3,799
2.7
2.8
11.0
14.0
13.0
10.2
1.4
1.2
11.2
12.7
-
-
LIC Housing Finance
Accumulate
548
630
27,656
3,712
4,293
2.6
2.5
39.0
46.0
14.1
11.9
2.6
2.3
19.9
20.1
-
-
Punjab Natl.Bank
Neutral
127
-
27,036
23,532
23,595
2.3
2.4
6.8
12.6
18.7
10.1
2.9
2.1
3.3
6.5
-
-
RBL Bank
Neutral
340
-
12,583
1,783
2,309
2.6
2.6
12.7
16.4
26.8
20.8
2.9
2.6
12.8
13.3
-
-
South Ind.Bank
Neutral
21
-
2,883
6,435
7,578
2.5
2.5
2.7
3.1
7.9
6.9
1.0
0.9
10.1
11.2
-
-
St Bk of India
Neutral
263
-
203,928
88,650
98,335
2.6
2.6
13.5
18.8
19.5
14.0
1.9
1.6
7.0
8.5
-
-
Union Bank
Neutral
140
-
9,600
13,450
14,925
2.3
2.3
25.5
34.5
5.5
4.1
0.8
0.7
7.5
10.2
-
-
Yes Bank
Neutral
1,197
-
50,408
8,978
11,281
3.3
3.4
74.0
90.0
16.2
13.3
3.1
2.6
17.0
17.2
-
-
FMCG
Asian Paints
Neutral
913
-
87,599
17,128
18,978
16.8
16.4
19.1
20.7
47.8
44.1
16.6
15.7
34.8
35.5
5.0
4.5
Britannia
Buy
2,943
3,626
35,308
9,594
11,011
14.6
14.9
80.3
94.0
36.7
31.3
15.1
11.6
41.2
-
3.5
3.0
Colgate
Accumulate
906
995
24,630
4,605
5,149
23.4
23.4
23.8
26.9
38.1
33.7
21.1
16.5
64.8
66.8
5.3
4.7
Dabur India
Accumulate
276
304
48,526
8,315
9,405
19.8
20.7
8.1
9.2
34.1
30.0
9.5
7.9
31.6
31.0
5.5
4.8
GlaxoSmith Con*
Neutral
4,995
-
21,007
4,350
4,823
21.2
21.4
179.2
196.5
27.9
25.4
7.4
6.3
27.1
26.8
4.2
3.7
Godrej Consumer
Neutral
1,449
-
49,335
10,235
11,428
18.4
18.6
41.1
44.2
35.3
32.8
7.8
6.6
24.9
24.8
4.9
4.3
HUL
Neutral
822
-
177,912
35,252
38,495
17.8
17.8
20.7
22.4
39.8
36.7
38.1
32.6
95.6
88.9
4.9
4.5
ITC
Buy
233
284
281,371
40,059
44,439
38.3
39.2
9.0
10.1
26.0
23.0
7.2
6.3
27.8
27.5
6.5
5.9
Marico
Buy
253
300
32,667
6,430
7,349
18.8
19.5
6.4
7.7
39.6
32.9
11.9
10.1
33.2
32.5
4.9
4.2
Nestle*
Neutral
6,236
-
60,123
10,073
11,807
20.7
21.5
124.8
154.2
50.0
40.4
20.5
18.5
34.8
36.7
5.8
4.9
Tata Global
Neutral
123
-
7,747
8,675
9,088
9.8
9.8
7.4
8.2
16.6
15.0
1.9
1.8
7.9
8.1
0.8
0.8
Stock Watch
December 15, 2016
Company Name
Reco
CMP
Target
Mkt Cap
Sales ( Čcr )
OPM(%)
EPS (Č)
PER(x)
P/BV(x)
RoE(%)
EV/Sales(x)
(Č)
Price ( Č)
( Č cr )
FY17E FY18E
FY17E
FY18E
FY17E
FY18E
FY17E
FY18E
FY17E
FY18E
FY17E
FY18E
FY17E
FY18E
FMCG
Procter & Gamble
Accumulate
6,794
7,369
22,055
2,939
3,342
23.2
23.0
146.2
163.7
46.5
41.5
104.1
99.8
25.3
23.5
7.0
6.1
Hygiene
IT
HCL Tech^
Buy
820
1,000
115,668
49,242
57,168
20.5
20.5
55.7
64.1
14.7
12.8
3.0
2.3
20.3
17.9
2.2
1.8
Infosys
Buy
999
1,249
229,476
68,350
77,326
27.0
27.0
62.5
69.4
16.0
14.4
3.4
3.1
21.3
21.6
2.8
2.4
TCS
Buy
2,208
2,620
435,051
119,025
133,308
27.6
27.6
131.2
145.5
16.8
15.2
5.5
5.0
32.4
33.1
3.4
3.0
Tech Mahindra
Buy
476
600
46,191
29,673
32,937
15.5
17.0
32.8
39.9
14.5
11.9
2.9
2.5
19.6
20.7
1.3
1.1
Wipro
Buy
465
590
113,041
55,440
60,430
18.1
18.1
35.9
39.9
13.0
11.7
2.3
2.1
19.0
19.3
1.8
1.6
Media
D B Corp
Neutral
357
-
6,560
2,297
2,590
27.4
28.2
21.0
23.4
17.0
15.3
4.0
3.4
23.7
23.1
2.7
2.3
HT Media
Neutral
73
-
1,710
2,693
2,991
12.6
12.9
7.9
9.0
9.3
8.2
0.8
0.7
7.8
8.3
0.2
0.1
Jagran Prakashan
Buy
168
225
5,484
2,355
2,635
28.0
28.0
10.8
12.5
15.5
13.4
3.4
2.9
21.7
21.7
2.3
2.1
Sun TV Network
Neutral
499
-
19,659
2,850
3,265
70.1
71.0
26.2
30.4
19.0
16.4
4.9
4.3
24.3
25.6
6.5
5.5
Hindustan Media
Neutral
260
-
1,910
1,016
1,138
24.3
25.2
27.3
30.1
9.5
8.6
1.8
1.6
16.2
15.8
1.2
1.0
Ventures
TV Today Network
Buy
286
385
1,703
637
743
27.5
27.5
18.4
21.4
15.5
13.4
2.7
2.3
17.4
17.2
2.3
1.9
Metals & Mining
Coal India
Neutral
292
-
184,596
84,638
94,297
21.4
22.3
24.5
27.1
11.9
10.8
5.0
4.7
42.6
46.0
1.7
1.5
Hind. Zinc
Neutral
276
-
116,577
14,252
18,465
55.9
48.3
15.8
21.5
17.5
12.8
2.8
2.5
17.0
20.7
8.2
6.3
Hindalco
Neutral
176
-
36,354
107,899
112,095
7.4
8.2
9.2
13.0
19.1
13.5
0.9
0.9
4.8
6.6
0.9
0.8
JSW Steel
Neutral
1,631
-
39,421
53,201
58,779
16.1
16.2
130.6
153.7
12.5
10.6
1.7
1.5
14.0
14.4
1.5
1.3
NMDC
Neutral
128
-
40,403
6,643
7,284
44.4
47.7
7.1
7.7
18.0
16.6
1.6
1.5
8.8
9.2
3.9
3.5
SAIL
Neutral
52
-
21,662
47,528
53,738
(0.7)
2.1
(1.9)
2.6
20.2
0.6
0.6
(1.6)
3.9
1.3
1.2
Vedanta
Neutral
236
-
69,937
71,744
81,944
19.2
21.7
13.4
20.1
17.6
11.7
1.5
1.4
8.4
11.3
1.4
1.1
Tata Steel
Neutral
418
-
40,553
121,374
121,856
7.2
8.4
18.6
34.3
22.5
12.2
1.4
1.3
6.1
10.1
1.0
1.0
Oil & Gas
Cairn India
Neutral
261
-
48,943
9,127
10,632
4.3
20.6
8.8
11.7
29.7
22.3
1.0
0.9
3.3
4.2
6.8
5.7
GAIL
Neutral
419
-
53,162
56,220
65,198
9.3
10.1
27.1
33.3
15.5
12.6
1.4
1.3
9.3
10.7
1.1
1.0
ONGC
Neutral
306
-
261,413
137,222
152,563
15.0
21.8
19.5
24.1
15.7
12.7
1.3
1.3
8.5
10.1
2.2
2.0
Indian Oil Corp
Neutral
299
-
145,264
373,359
428,656
5.9
5.5
54.0
59.3
5.5
5.0
0.9
0.8
16.0
15.6
0.5
0.5
Reliance Industries
Neutral
1,060
-
343,699
301,963
358,039
12.1
12.6
87.7
101.7
12.1
10.4
1.2
1.1
10.7
11.3
1.6
1.3
Pharmaceuticals
Alembic Pharma
Neutral
632
-
11,913
3,483
4,083
20.2
21.4
24.3
30.4
26.0
20.8
5.9
4.7
25.5
25.3
3.4
2.8
Alkem Laboratories Ltd
Buy
1,615
1,989
19,310
6,043
6,893
18.7
19.3
80.5
88.8
20.1
18.2
4.5
3.7
22.3
20.3
3.1
2.7
Aurobindo Pharma
Buy
704
877
41,170
15,720
18,078
23.7
23.7
41.4
47.3
17.0
14.9
4.4
3.5
29.6
26.1
2.8
2.5
Aventis*
Neutral
4,351
-
10,019
2,277
2,597
17.3
18.3
149.4
172.0
29.1
25.3
4.8
3.9
25.1
28.8
4.1
3.3
Stock Watch
December 15, 2016
Company Name
Reco
CMP
Target
Mkt Cap
Sales ( Čcr )
OPM(%)
EPS (Č)
PER(x)
P/BV(x)
RoE(%)
EV/Sales(x)
(Č)
Price ( Č)
( Č cr )
FY17E FY18E
FY17E
FY18E
FY17E
FY18E
FY17E
FY18E
FY17E
FY18E
FY17E
FY18E
FY17E
FY18E
Pharmaceuticals
Cadila Healthcare
Neutral
384
-
39,342
10,429
12,318
22.6
22.0
16.9
19.2
22.7
20.0
5.8
4.7
28.5
25.7
3.8
3.1
Cipla
Reduce
568
490
45,679
15,378
18,089
17.4
18.4
21.6
27.2
26.3
20.9
3.4
3.0
13.7
15.2
3.2
2.6
Dr Reddy's
Neutral
3,143
-
52,085
16,043
18,119
20.8
22.4
112.4
142.9
28.0
22.0
3.7
3.3
14.1
15.9
3.2
2.8
Dishman Pharma
Neutral
223
-
3,594
1,718
1,890
22.7
22.8
9.5
11.3
23.4
19.7
2.3
2.1
10.1
10.9
2.6
2.2
GSK Pharma*
Neutral
2,728
-
23,105
3,000
3,312
15.4
20.6
46.5
60.8
58.7
44.9
14.1
14.0
26.3
30.6
7.4
6.8
Indoco Remedies
Reduce
260
240
2,392
1,112
1,289
16.2
18.2
11.6
16.0
22.4
16.2
3.6
3.0
17.0
20.1
2.3
1.9
Ipca labs
Accumulate
538
613
6,782
3,303
3,799
15.3
15.3
17.3
19.7
31.1
27.3
2.7
2.5
9.1
9.4
2.2
1.9
Lupin
Buy
1,486
1,809
67,002
15,912
18,644
26.4
26.7
58.1
69.3
25.6
21.5
5.0
4.1
21.4
20.9
4.3
3.5
Sun Pharma
Buy
679
847
163,427
31,129
35,258
32.0
32.9
30.2
35.3
22.5
19.2
3.7
3.0
20.0
20.1
4.8
4.1
Power
Tata Power
Neutral
79
-
21,285
36,916
39,557
17.4
27.1
5.1
6.3
15.4
12.5
1.4
1.3
9.0
10.3
1.6
1.4
NTPC
Neutral
164
-
134,896
86,605
95,545
17.5
20.8
11.8
13.4
13.9
12.2
1.4
1.3
10.5
11.1
2.9
2.9
Power Grid
Buy
182
223
95,163
25,315
29,193
88.2
88.7
14.2
17.2
12.9
10.6
2.0
1.7
15.2
16.1
8.4
7.6
Real Estate
Prestige Estate
Buy
163
210
6,128
4,707
5,105
25.2
26.0
10.3
13.0
15.9
12.6
1.3
1.2
10.3
10.2
2.5
2.2
MLIFE
Buy
360
522
1,477
1,152
1,300
22.7
24.6
29.9
35.8
12.0
10.1
0.9
0.8
7.6
8.6
2.0
1.7
Telecom
Bharti Airtel
Neutral
322
-
128,896
105,086
114,808
34.5
34.7
12.2
16.4
26.4
19.7
1.8
1.7
6.8
8.4
2.1
1.9
Idea Cellular
Neutral
77
-
27,762
40,133
43,731
37.2
37.1
6.4
6.5
12.1
11.9
1.0
0.9
8.2
7.6
1.7
1.5
zOthers
Abbott India
Neutral
4,697
-
9,980
3,153
3,583
14.1
14.4
152.2
182.7
30.9
25.7
151.5
129.4
25.6
26.1
2.9
2.5
Asian Granito
Buy
212
351
638
1,071
1,182
12.1
12.4
12.7
16.0
16.7
13.3
1.6
1.4
9.5
10.7
0.9
0.8
Bajaj Electricals
Buy
221
274
2,237
4,801
5,351
5.7
6.2
10.4
13.7
21.2
16.2
2.6
2.3
12.4
14.5
0.5
0.4
Banco Products (India)
Neutral
191
-
1,368
1,353
1,471
12.3
12.4
14.5
16.3
13.2
11.7
18.2
16.4
14.5
14.6
1.0
101.8
Coffee Day Enterprises
Neutral
200
-
4,116
2,964
3,260
20.5
21.2
4.7
8.0
-
25.0
2.3
2.1
5.5
8.5
1.8
1.6
Ltd
Competent Automobiles Neutral
173
-
106
1,137
1,256
3.1
2.7
28.0
23.6
6.2
7.3
33.2
30.0
14.3
11.5
0.1
0.1
Elecon Engineering
Neutral
59
-
662
1,482
1,660
13.7
14.5
3.9
5.8
15.1
10.2
3.6
3.3
7.8
10.9
0.8
0.7
Finolex Cables
Neutral
426
-
6,518
2,883
3,115
12.0
12.1
14.2
18.6
30.0
22.9
16.0
14.0
15.8
14.6
2.0
1.8
Garware Wall Ropes
Neutral
631
-
1,381
873
938
14.3
14.3
35.2
37.5
18.0
16.8
3.1
2.7
17.5
15.9
1.5
1.4
Goodyear India*
Neutral
711
-
1,640
1,598
1,704
10.4
10.2
49.4
52.6
14.4
13.5
66.4
58.3
18.2
17.0
0.7
98.7
Hitachi
Neutral
1,482
-
4,030
2,081
2,433
8.8
8.9
33.4
39.9
44.4
37.1
35.8
29.8
22.1
21.4
1.9
1.6
HSIL
Neutral
279
-
2,020
2,384
2,515
15.8
16.3
15.3
19.4
18.3
14.4
18.1
15.6
7.8
9.3
1.0
0.9
Interglobe Aviation
Neutral
818
-
29,470
21,122
26,005
14.5
27.6
110.7
132.1
7.4
6.2
44.2
31.6
168.5
201.1
1.4
1.1
Stock Watch
December 15, 2016
Company Name
Reco
CMP
Target
Mkt Cap
Sales ( Čcr )
OPM(%)
EPS (Č)
PER(x)
P/BV(x)
RoE(%)
EV/Sales(x)
(Č)
Price ( Č)
( Č cr )
FY17E
FY18E
FY17E
FY18E
FY17E
FY18E
FY17E
FY18E
FY17E
FY18E
FY17E
FY18E
FY17E
FY18E
zOthers
Jyothy Laboratories
Neutral
364
-
6,616
1,440
2,052
11.5
13.0
8.5
10.0
42.9
36.4
10.4
9.6
18.6
19.3
4.9
3.4
Kirloskar Engines India
Neutral
325
-
4,701
2,554
2,800
9.9
10.0
10.5
12.1
31.0
26.9
13.0
12.2
10.7
11.7
1.5
1.3
Ltd
Linc Pen & Plastics
Neutral
232
-
343
382
420
9.3
9.5
13.5
15.7
17.2
14.8
3.0
2.6
17.1
17.3
1.0
0.9
M M Forgings
Neutral
448
-
541
546
608
20.4
20.7
41.3
48.7
10.9
9.2
61.4
54.3
16.6
17.0
0.8
0.7
Manpasand Bever.
Neutral
574
-
3,282
836
1,087
19.6
19.4
16.9
23.8
34.0
24.1
4.1
3.6
12.0
14.8
3.7
2.7
Mirza International
Buy
82
107
984
987
1,106
18.0
18.0
6.5
7.6
12.5
10.7
2.0
1.7
15.9
15.7
1.2
1.1
MT Educare
Neutral
118
-
469
366
417
17.7
18.2
9.4
10.8
12.6
10.9
2.8
2.4
22.2
22.3
1.2
1.0
Narayana Hrudaya
Neutral
338
-
6,904
1,873
2,166
11.5
11.7
2.6
4.0
127.7
85.2
7.8
7.1
6.1
8.3
3.8
3.3
Navkar Corporation
Buy
175
265
2,494
369
561
42.9
42.3
7.2
11.5
24.2
15.2
1.8
1.6
7.4
10.5
7.8
5.1
Navneet Education
Neutral
109
-
2,594
1,062
1,147
24.0
24.0
6.1
6.6
17.9
16.4
3.7
3.3
20.6
19.8
2.5
2.3
Nilkamal
Neutral
1,323
-
1,974
1,995
2,165
10.7
10.4
69.8
80.6
19.0
16.4
75.6
65.7
16.6
16.5
1.0
0.9
Page Industries
Neutral
13,485
-
15,041
2,450
3,124
20.1
17.6
299.0
310.0
45.1
43.5
300.3
229.3
47.1
87.5
6.2
4.9
Parag Milk Foods
Neutral
269
-
2,263
1,919
2,231
9.3
9.6
9.5
12.9
28.5
20.8
4.4
3.7
15.5
17.5
1.3
1.1
Quick Heal
Neutral
274
-
1,917
408
495
27.3
27.0
7.7
8.8
35.4
31.1
3.3
3.3
9.3
10.6
3.8
3.2
Radico Khaitan
Buy
119
147
1,579
1,667
1,824
13.0
13.2
6.7
8.2
17.9
14.5
1.6
1.5
9.0
10.2
1.3
1.2
Relaxo Footwears
Neutral
400
-
4,802
2,085
2,469
9.2
8.2
7.6
8.0
52.9
50.3
20.5
17.5
17.9
18.8
2.4
2.0
S H Kelkar & Co.
Neutral
289
-
4,173
1,036
1,160
15.1
15.0
6.1
7.2
47.3
40.2
5.1
4.6
10.7
11.5
3.9
3.4
Siyaram Silk Mills
Accumulate
1,202
1,605
1,127
1,733
1,948
11.6
11.7
96.6
114.7
12.4
10.5
1.9
1.6
15.3
15.7
0.9
0.8
Styrolution ABS India*
Neutral
589
-
1,036
1,440
1,537
9.2
9.0
40.6
42.6
14.5
13.8
37.1
33.7
12.3
11.6
0.7
0.6
Surya Roshni
Neutral
181
-
793
3,342
3,625
7.8
7.5
17.3
19.8
10.5
9.2
19.9
16.0
10.5
10.8
0.5
0.4
Team Lease Serv.
Neutral
880
-
1,505
3,229
4,001
1.5
1.8
22.8
32.8
38.7
26.8
4.1
3.6
10.7
13.4
0.4
0.3
The Byke Hospitality
Neutral
168
-
674
287
384
20.5
20.5
7.6
10.7
22.1
15.7
4.6
3.7
20.7
23.5
2.4
1.8
Transport Corporation of
Neutral
175
-
1,341
2,671
2,911
8.5
8.8
13.9
15.7
12.6
11.2
1.7
1.5
13.7
13.8
0.6
0.6
India
TVS Srichakra
Neutral
3,412
-
2,612
2,304
2,614
13.7
13.8
231.1
266.6
14.8
12.8
383.4
301.9
33.9
29.3
1.1
1.0
UFO Moviez
Neutral
423
-
1,167
619
685
33.2
33.4
30.0
34.9
14.1
12.1
2.0
1.7
13.8
13.9
1.6
1.3
Visaka Industries
Neutral
186
-
296
1,051
1,138
10.3
10.4
21.0
23.1
8.9
8.1
23.9
22.4
9.0
9.2
0.5
0.5
VRL Logistics
Neutral
266
-
2,423
1,902
2,119
16.7
16.6
14.6
16.8
18.2
15.8
4.0
3.5
21.9
22.2
1.4
1.2
Wonderla Holidays
Neutral
331
-
1,867
287
355
38.0
40.0
11.3
14.2
29.3
23.3
4.2
3.7
21.4
23.9
6.2
5.0
Source: Company, Angel Research; Note: *December year end; #September year end; &October year end; Price as on December 14, 2016
Market Outlook
December 15, 2016
Research Team Tel: 022 - 39357800
DISCLAIMER
Angel Broking Private Limited (hereinafter referred to as “Angel”) is a registered Member of National Stock Exchange of India
Limited,Bombay Stock Exchange Limited and Metropolitan Stock Exchange Limited. It is also registered as a Depository Participant with
CDSL and Portfolio Manager with SEBI. It also has registration with AMFI as a Mutual Fund Distributor. Angel Broking Private Limited is a
registered entity with SEBI for Research Analyst in terms of SEBI (Research Analyst) Regulations, 2014 vide registration number
INH000000164. Angel or its associates has not been debarred/ suspended by SEBI or any other regulatory authority for accessing
/dealing in securities Market. Angel or its associates/analyst has not received any compensation / managed or
co-managed public offering of securities of the company covered by Analyst during the past twelve months.
This document is solely for the personal information of the recipient, and must not be singularly used as the basis of any investment
decision. Nothing in this document should be construed as investment or financial advice. Each recipient of this document should make
such investigations as they deem necessary to arrive at an independent evaluation of an investment in the securities of the companies
referred to in this document (including the merits and risks involved), and should consult their own advisors to determine the merits and
risks of such an investment.
Reports based on technical and derivative analysis center on studying charts of a stock's price movement, outstanding positions and
trading volume, as opposed to focusing on a company's fundamentals and, as such, may not match with a report on a company's
fundamentals. Investors are advised to refer the Fundamental and Technical Research Reports available on our website to evaluate the
contrary view, if any.
The information in this document has been printed on the basis of publicly available information, internal data and other reliable
sources believed to be true, but we do not represent that it is accurate or complete and it should not be relied on as such, as this
document is for general guidance only. Angel Broking Pvt. Limited or any of its affiliates/ group companies shall not be in any way
responsible for any loss or damage that may arise to any person from any inadvertent error in the information contained in this report.
Angel Broking Pvt. Limited has not independently verified all the information contained within this document. Accordingly, we cannot
testify, nor make any representation or warranty, express or implied, to the accuracy, contents or data contained within this document.
While Angel Broking Pvt. Limited endeavors to update on a reasonable basis the information discussed in this material, there may be
regulatory, compliance, or other reasons that prevent us from doing so.
This document is being supplied to you solely for your information, and its contents, information or data may not be reproduced,
redistributed or passed on, directly or indirectly.
Neither Angel Broking Pvt. Limited, nor its directors, employees or affiliates shall be liable for any loss or damage that may arise from
or in connection with the use of this information.